Global Sustainable Fund Report
The Morgan Stanley Institute for Sustainable Investing releases 2024 H1 Global Sustainable Fund Report, aimed at analyzing the size and performance of global sustainable funds.
Morgan Stanley uses data from January 2024 to June 2024, covering a total of 99000 funds worldwide, with sustainable and non-sustainable funds defined by Morningstar.
Related Post: European Fund and Asset Management Association Releases Sustainable Equity Fund Report
Global Sustainable Fund AUM and Returns
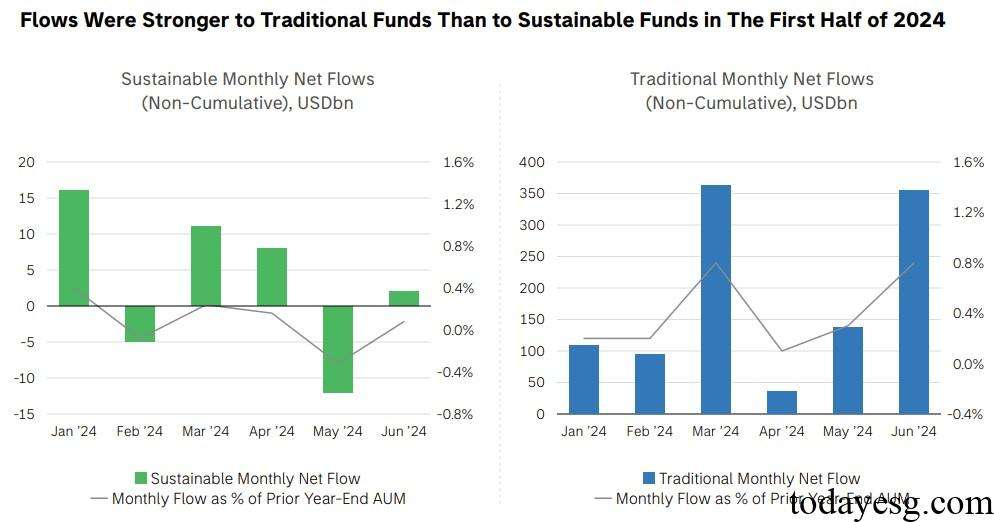
As of June 2024, the AUM of global sustainable funds has reached $3.5 trillion, an increase of 3.9% compared to the end of the year, accounting for 7% of the total assets of global funds. In the first half of 2024, the cumulative inflow of global sustainable funds reached $20 billion, with $22 billion inflow in the first quarter and $2 billion outflow in the second quarter. This is also the first time that sustainable funds have recorded outflows since 2022. Non-sustainable funds have gained investor attention in the first half of the year, recording inflows for six months since January 2024.

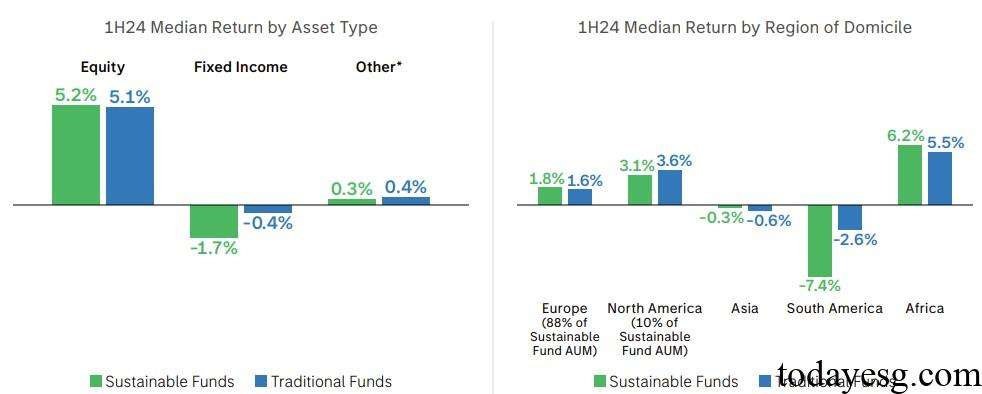
In the first half of 2024, sustainable funds performed better than non-sustainable funds, with a median return rate of 1.7% for sustainable funds and 1.1% for non-sustainable funds. The reason for the good performance of sustainable funds is that the proportion of stock funds is higher (57%), while the proportion of stock funds in non-sustainable funds is lower (39%). In terms of bond assets, sustainable funds have shown weaker performance with a return of -1.7%, while non-sustainable funds have performed better with a return of -0.4%.
From the analysis of fund domicile, the return of sustainable funds in Europe (1.8%) is higher than that of non-sustainable funds (1.6%), while the return of sustainable funds in North America (3.1%) is lower than that of non-sustainable funds (3.6%). Sustainable funds in Europe and North America account for 98% of the total size of global sustainable funds. Funds in Asia and South America both recorded negative returns, and sustainable funds in Africa have the highest return (6.2%) and non-sustainable funds have the highest return (5.5%).

88% of global sustainable funds are registered in Europe, and 33% of sustainable assets are invested in Europe. These funds are regulated by the Sustainable Finance Disclosure Regulation (SFDR) and are divided into Article 8 and Article 9 funds. In the first half of 2024, the return of Article 8 Fund was 1.6%, and the return of Article 9 Fund was 1.4%. According to Morningstar’s classification method, one-third of Article 8 funds and all Article 9 funds are classified as sustainable funds. These sustainable funds had a return of 1.8% in the first half of the year, higher than non-sustainable funds (1.6%) and higher than Article 8 and Article 9 funds.

Sustainable Fund Volatility and Long-term Performance
The Morgan Stanley Institute for Sustainable Investing finds that the returns of sustainable and non-sustainable funds fluctuate greatly, and using the median can better represent return. In the first half of 2024, 59% of sustainable funds recorded positive returns, while 55% of non-sustainable funds recorded negative returns. The downward deviation of sustainable funds is 9.9%, and the downward deviation of non-sustainable funds is -10.6%. Lower downward deviation indicates greater possibility of negative returns relative to the fund benchmark.
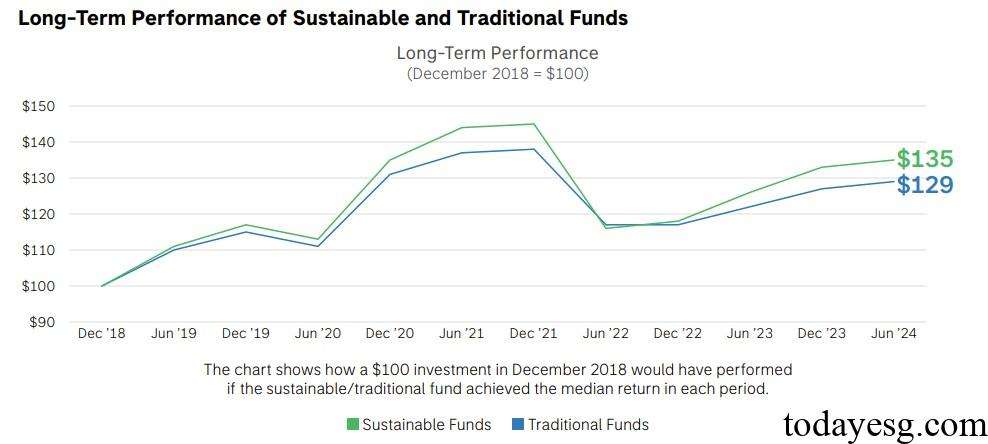
Long-term performance of sustainable funds is higher than that of non-sustainable funds. Taking the investment of $100 in December 2018 as an example, as of August 2024, sustainable funds reached $135 and non-sustainable funds reached $129. In 2022, the performance of sustainable funds was weaker than that of non-sustainable funds, while the overall performance was stronger after that.

Reference:
Sustainable Funds Modestly Outperform in First Half 2024
ESG Advertisements Contact:todayesg@gmail.com


